

Home
Studies
& Data Analysis
Methods
Microscope studies
Flagella experiment
Laboratory math
Blood fractionation
Gel electrophoresis
Protein gel analysis
Mitochondria
Concepts/ theory
Keeping a lab notebook
Writing research papers
Dimensions & units
Using figures (graphs)
Examples of graphs
Experimental error
Representing error
Applying statistics
Principles of microscopy
Solutions & dilutions
Protein assays
Spectrophotometry
Fractionation & centrifugation
Radioisotopes and detection
Guide to the study
Lab part 1
- tutorial/specimens
- Paramecium
- Chlamydomonas
- fixing/observingflagella
- Chaos (Pelomyxa) carolinensis
- Naegleria gruberi
- the five kingdoms
Lab part 2
- experiment introduction
- microtubules
- amputating flagella
- experimental design
- data collection
- class data
Flagella Regeneration Data
Here is a figure representing data from a previous semester's results. The data were consistent with what we see when the experiment is not compromised. This figure is NOT for inclusion in your research paper. It is presented here to help you interpret the data. You may reference this web page in your paper should you refer to this information. Note how the figure was designed – no frills, just information.
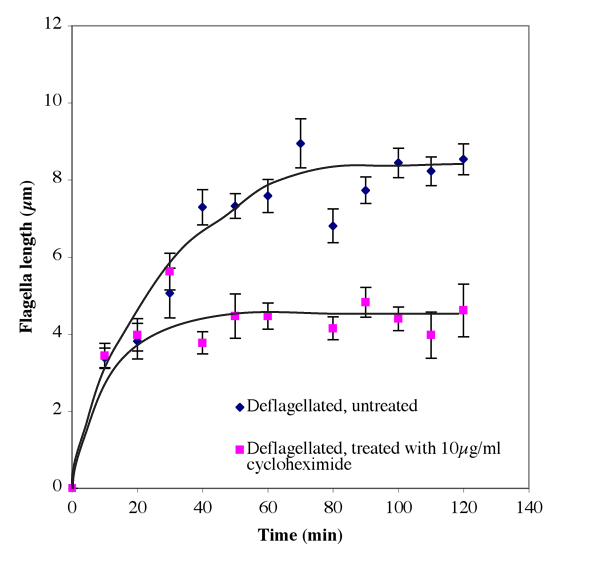
Fig. 1. Time course of flagellar regeneration following amputation of flagella in Chlamydomonas reinhardii untreated and treated to prevent protein synthesis. Bars represent standard deviations of the means.
Visitors: to ensure that your message is not mistaken for SPAM, please include the acronym "Bios211" in the subject line of e-mail communications
Created by David R. Caprette (caprette@rice.edu), Rice University 13 May 05
Updated 13 Aug 07