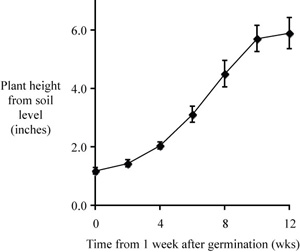
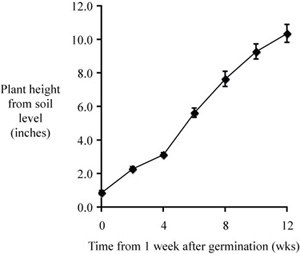
Here are the two plots side by side. We won't call them figures because there are no captions.
|
|
What did you decide? Will this comparison work? Each plot accurately depicts the growth rate of the respective species, and optimizes use of the plot area. However, at first glance it appears that the growth rates were nearly identical. One has to look carefully at the y axis scales to realize that seedlings of Morus alba grew about twice as fast as did seedlings of Acer palmatum. We really don't want to mislead a reader, do we?
You could plot each data set using the same scale, but then half of the plot area for the Acer palmatum data would be empty. Why not plot both data sets on the same set of axes?
Let's start with the plot for Morus alba. Adding the Acer set will not require modifying the scale. Adding the Morus set to the Acer graph would require changing the scale, of course. Select the graph and go to the menu item Chart/Source Data... Choose Series. The window should indicate "series 1," which is the data set already plotted. You want to add a series, so choose Add.
"Series 2" must be defined by selecting the cells for the X values and the cells for the Y values. Data representing the independent variable go into the X value box (select the cells directly) and data representing the dependent variable go into the Y value box. Select OK.
Time is the independent variable, to be plotted on the x axis; height (a measured quantity) is a dependent variable, to be plotted on the y axis.
A good choice for plotting these data is to use a scatter plot (XY scatter) of mean values verus time, rather than a scatter plot of raw data; other plot types are not suitable for this kind of data set.
"Computer clutter" should be replaced by X and Y axis labels, a figure caption, and perhaps an appropriate trend line.
A good caption includes just enough information to permit it to stand apart from text.
We typially include an error estimate when reporting mean values
– standard deviations for means reported in text or a table and
error bars representing the s.e.m.s for mean valuess in a scatter
plot.