The standard error of the mean is the smaller value. It is the standard deviation divided by the square root of N, the number of data points in the set, which will always be > 1. Perhaps more importantly, the s.e.m. represents the expected deviation of sample means, for the sample size used, from the true mean that you are trying to determine.
It was necessary, not too long ago, to calculate standard deviations by hand. Later, calculators made the work go faster but it was still necessary to complete each operation individually. Nearly universal access to computers with statistical software has saved us a lot of time. Microsoft Excel comes with an Insert/Function... menu item that becomes available when a cell is selected. Among the categories of functions that can be inserted in a cell are Math & Trig and Statistical. To calculate the errors, go back to your data table and set up two more rows as in the example below. Format the cells to one decimal place as with the others.
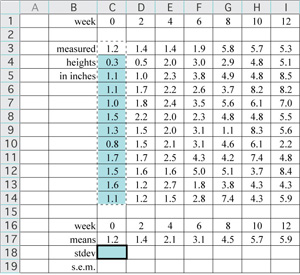
Select the blank cell under the mean value for week 0 (cell C18 in the example), then go to Insert, choose Function..., and when the "Paste Function" box comes up choose Statistical. Scroll to STDEV, read the description, and click OK. Now you will see a new dialog box asking you to input a "number." It is actually asking for an array of numbers. Select all of the data in the column for week 0 (cells C3:C14 in the example). Click OK and a number representing the standard deviation should appear in cell C18. Now you can copy cell C18 and paste into the cells in the same row under the remaining data columns. Formulas are relative in Excel. When you copy a cell with the formula "=STDEV(C3:C14)" from cell C18 to cell D18, it is automatically converted to "=STDEV(D3:D14)".
You can also enter formulas by typing them in, starting with the = sign. Now we need to divide the standard deviation by the square root of N, the number of data points in each set. You know that you have 12 data points in each sample, so in this example you can simply enter into cell C19 the formula "=STDEV(C3:C11)/SQRT(12)". Copy the cell and paste into the adjacent cells to complete the s.e.m. calculation for each data set. You could also type the = sign and select cell C18, then complete the formula to read, "=C18/SQRT(12)". If you have large data sets you might use the COUNTA( ) function to obtain N. COUNTA( ) returns the number of cells with data in them. The formula "=C18/SQRT(COUNTA(C3:C14))" gives you the same result.
Go ahead and calculate the errors, then we'll put them into your figure.
To one decimal place, what did you get for the standard deviation for week 6?
What did you get for the standard error of the mean for week 6?
Time is the independent variable, to be plotted on the x axis; height (a measured quantity) is a dependent variable, to be plotted on the y axis.
A good choice for plotting these data is to use a scatter plot (XY scatter) of mean values verus time, rather than a scatter plot of raw data; other plot types are not suitable for this kind of data set.
"Computer clutter" should be replaced by X and Y axis labels, a figure caption, and perhaps an appropriate trend line.
A good caption includes just enough information to permit it to stand apart from text.
We typially include an error estimate when reporting mean values
– standard deviations for means reported in text or a table and
error bars representing the s.e.m.s for mean values in a scatter
plot.