"The average weight loss for individuals in group 1 was 7.3 ± 2.4 pounds compared with 11.1 ± 2.7 for group 2."
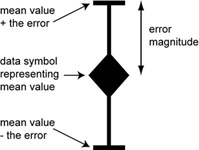
Just as a the position of a plot symbol represents a mean value on a set of axes, a symbol called an error bar can be used to represent experimental error. The length of an error bar in each direction indicates the magnitude of the error.
|
|
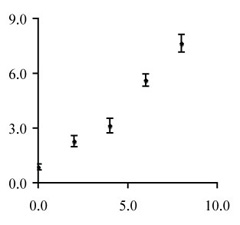
The s.e.m. is often used to represent error when data are presented visually. The two figures below illustrate why.
 |
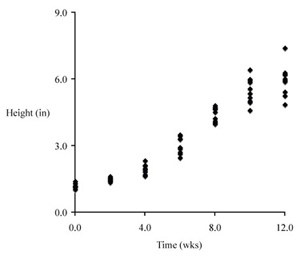 |
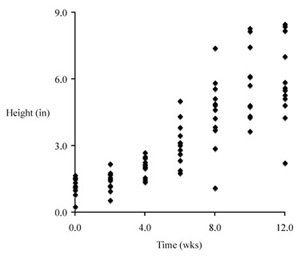
You might recognize the figure at left as a scatter plot of raw data. It shows the wide scattering of the twelve individual data points in each biweekly sample. A sample standard deviation would be used to represent this scatter. The figure at right is also a scatter plot, but the data symbols represent mean values from ten different samples of twelve data points each. Clearly, a typical sample mean is unlikely to deviate as far from the true relationship as will a typical single data point.
The s.e.m. for a sample represents our confidence in the position of a mean value on a graph. Thus we normally use s.e.m. to represent the errors in a scatter plot. We may use s.e.m. or standard deviation in a column plot, depending on which error estimate is most relevant. In the caption one should indicate the type of error used.
Just as a quick check, which is going to be a smaller value, the sample standard deviation or the standard error of the mean (s.e.m.)?
Standard deviation
Standard error of the mean
Time is the independent variable, to be plotted on the x axis; height (a measured quantity) is a dependent variable, to be plotted on the y axis.
A good choice for plotting these data is to use a scatter plot (XY scatter) of mean values verus time, rather than a scatter plot of raw data; other plot types are not suitable for this kind of data set.
"Computer clutter" should be replaced by X and Y axis labels, a figure caption, and perhaps an appropriate trend line.
A good caption includes just enough information to permit it to stand apart from text.