

Home
Studies
& Data Analysis
Methods
Microscope studies
Flagella experiment
Laboratory math
Blood fractionation
Gel electrophoresis
Protein gel analysis
Mitochondria
Concepts/ theory
Keeping a lab notebook
Writing research papers
Dimensions & units
Using figures (graphs)
Examples of graphs
Experimental error
Representing error
Applying statistics
Principles of microscopy
Solutions & dilutions
Protein assays
Spectrophotometry
Fractionation & centrifugation
Radioisotopes and detection
Guide to the study
Lab part 1
- tutorial/specimens
- Paramecium
- Chlamydomonas
- fixing/observingflagella
- Chaos (Pelomyxa) carolinensis
- Naegleria gruberi
- the five kingdoms
Lab part 2
- experiment introduction
- microtubules
- amputating flagella
- experimental design
- data collection
- class data
Feedback Inhibition
The intracellular concentrations of enzymes and other proteins are maintained at genetically predetermined "setpoints." Deviation of a concentration from its setpoint triggers events that can act at any point in a pathway to inhibit or promote synthesis of a protein, inactivate or activate an enzyme, promote or inhibit incorporation of a substance into a cell, etc. Feedback inhibition plays an important role in most regulatory processes.
In feedback inhibition, the level of a variable is monitored, and a change in the positive direction triggers a response that counteracts the change. A simple example of feedback inhibition is a thermostat connected to a heater. A sensor detects the temperature in the room, and when the temperature reaches a predetermined set point, the thermostat signals the furnace to shut off. When the temperature drops below the set point, the inhibition is released, and the furnace is turned back on.
Feedback inhibition can be part of a more complex regulatory mechanism. The same thermostat can control both the heater and the air conditioner, for example, so that any deviation up or down triggers a change in the opposite direction. When the temperature reaches above the set point the air conditioner kicks in, and when it drops the furnace kicks in.
Example: control of a protein's concentration
The top figure shows a plot frame for concentration of a specific protein versus time. The dashed line indicates the setpoint level, that is, the concentration that has been genetically predetermined. The middle figure shows what we might observe if we were able to measure extremely minute variations in the concentration of protein x. The bottom figure illustrates the effect of this kind of regulation, namely to maintain the variable at a constant level.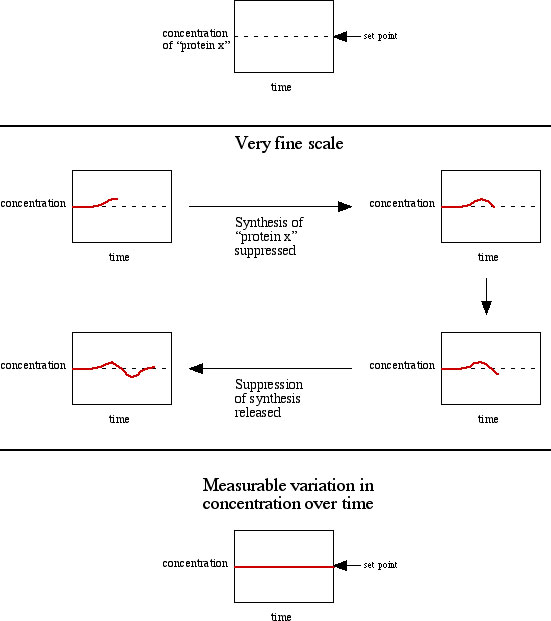
Example: control of blood pressure
The regulation of blood pressure is highly complex, involving multiple mechanisms that act in both the short term and the long term. Here is a simple scheme in which two processes act together to exert control over blood pressure. Vasodilation and vaso constriction refer respectively to the expansion or narrowing of the diameter of the arterioles.
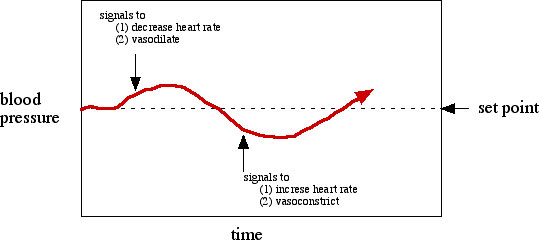
In this example a change in blood pressure may result in initiation rather than inhibition of a process such as increased sympathetic nervous system activity which in turn causes vasoconstriction. Thus there is feedback control, but not every process involved in this regulation is necessarily feedback inhibition. With blood pressure we actually are able to measure changes, sometimes very dramatic changes in fact. The physiological condition of the organism determines the setpoint for blood pressure. Genes are involved, of course, but genes are not the sole determinants of the setpoint.
Positive feedback
Contrast feedback inhibition with positive feedback. In the latter, a change in a variable triggers mechanisms that move the variable in the same direction. If the thermostat was miswired so as to trigger the furnace when the temperature increased, then when the furnace was first turned on the thermostat would keep it on until the room became unbearably hot. Global catastrophes have resulted from positive feedback. For example, global warming once was completely out of hand here on Earth; on the other hand it has been postulated that during one era the crust of the planet completely froze, also due to a kind of positive feedback. The planet Venus is believed to be extremely hot due to a runaway greenhouse effect ("runaway" is a euphemism for positive feedback). Another example of positive feedback is malignant hypertension. In this condition, an increase in blood pressure triggers mechanisms that cause pressure to rise further. Malignant hypertension quickly leads to coma and death.
Some positive feedback mechanisms are incorporated into our physiology. For example, as the urinary bladder fills mechanoreceptors are stimulated, leading to contraction of the smooth muscle of the bladder. As the bladder becomes progressively distended, the contractions increase and the feeling becomes more urgent. Runaway positive feedback doesn't occur, though. Contractions stop and start up again periodically. The smooth muscle of the uterus becomes more and more active at the end stages of pregnancy. Again, positive feedback is responsible. In both examples, relief is eventually necessary - urinate, or your bladder will rupture. I won't offend my female readers by suggesting that I have any idea what childbirth is like, but I imagine that when it is over it is a much greater relief than relieving one's bladder.
Visitors: to ensure that your message is not mistaken for SPAM, please include the acronym "Bios211" in the subject line of e-mail communications
Created by David R. Caprette (caprette@rice.edu), Rice University 8 Aug 96
Updated 16 May 05