The result rounds to 0.25. Usually, though, we would simply report "p < 0.03," a practice that may be left over from when we had to use tables. Very seldom does an author report the actual calculated p value. Generally one reports a p value as less then some critical value with one significant digit, e.g., < 0.05, < 0.02, < 0.01, < 0.005, etc. The p value suggests that the difference between means is marginally significant. To be more confident in the finding the investigator should repeat the experiment (usually necessary anyway) and collect more data. Of course there is a chance the difference will turn out to be insignificant after all.
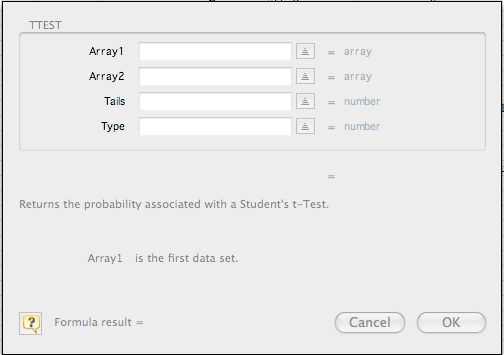
Now what was this business about "Tails" and "Type?"
We'll talk about "Tails" first, as the concept is a bit easier to grasp. The term "tails" refers to the tapering ends of a distribution curve. We put the number 2 in the box to indicate a two-tailed test. Our test is two-tailed because we are interested in a difference between two means. We look at the overlap between two tails, so the test is two tailed.
We use a one tailed test under more restricted circumstances. Suppose you want to know if something increased but do not care if it decreased. For example, suppose that we measure mean temperature over the past ten years in each of 20 selected locations around the world. We compare those data with data from the ten years previous to that period. All you ask is whether or not mean temperature increased. You do not care if it dropped (especially if you are trying to make a case for global warming). Here you would do a one-tailed test.
For most experiments your t tests will be two-tailed.