Did I say these questions would be tough? Of course if our investigator went by the recommended standards she would decide that her data sets were significantly different (not highly significant, though).
Here is the data set again.
| Quercus rubra | 6.4 | 7.4 | 10.4 | 8.5 | 9.2 | 9.5 | 11.8 | 11.8 | 9.3 | 12.5 | 13.7 | 17 |
| Quercus alba | 11.4 | 9.5 | 5.8 | 9.2 | 11.8 | 7.9 | 7.9 | 7.8 | 5.3 | 7.5 | 7.1 | 6.6 |
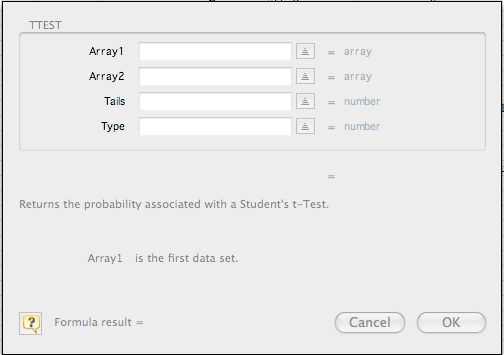
Paste or enter the two data sets into two columns A and B of an Excel spreadsheet. Now to conduct a t test select a blank cells and then go to Insert/Function..., select Statistical, and then select TTEST. A dialog box should pop up.
The cursor should be flashing in the box for "Array 1." If not, then make it so. Now select the first column of data. The dialog box should automatically move out of your way. Repeat for the second data set. In each of the boxes labeled "Tails" and "Type" enter the number 2. The "Formula result" that comes up in the dialog box is your p value.
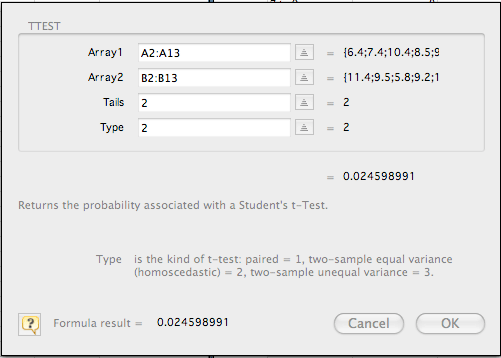
Now click OK and the p value appears in the cell that you selected. Did you find a significant difference between Q. rurbra and Q. alba seedlings with respect to height? What is your level of confidence?