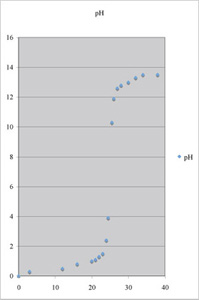
Here is what Excel brought up, using the defaults. Did yours look something like this?
This part will be very open-ended. Decide what to do to turn this "graph" into a figure suitable for publication. Apply your changes and go to the next page to compare your work with a graph prepared by an instructor.