If you look back at the previous windows it should be obvious
to you that the sample means changed as you collected data. After collecting
a great quantity of data the sample mean won't change much at all when you
add a few more data points. This is because your sample mean is approaching
the true mean µ of the population of all possible data.
The sample mean ![]() is
just an estimate of the true mean of the population.
is
just an estimate of the true mean of the population.
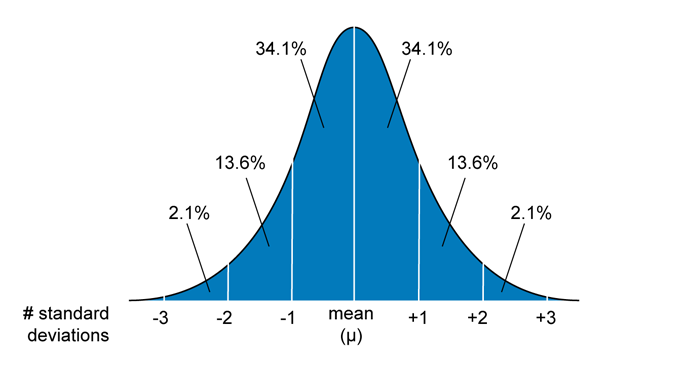
We refer to data as parametric when the population is normally distributed. With parametric data we can make some useful predictions. For example, 68.2% of the time the next data point you collect will fall in the central range of the distribution curve, within ± one standard deviation of the sample mean. A data point will fall within two standard deviations a whopping 95.4% of the time. Another way of stating this fact is to say that the probability of a data point falling within ± two standard deviations of the sample mean is > 0.95. The probability that the true mean is within two standard deviations of the sample mean is also > 0.95. Recall that a probability is a number greater than or equal to zero and less than or equal to 1. A probability of 0.5 corresponds to a 50:50 chance, for example.
What does all of this mean in terms of the difference between our growth rates?