Example: CF4
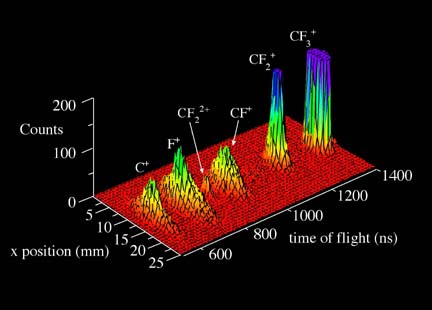
In order to accurately count the number of product ions produced it is necessary to collect them all. However, historically this has proven difficult because some of these ions are formed with significant kinetic energy and may escape detection. The figure to the right shows a combination time-and-position plot generated for the electron-impact ionization of CF4. The x-position indicates the location on the PSD where the various ions were detected along an axis perpendicular to the electron beam and is a measure of the kinetic energy of the fragment ions. Note that the width of the F+ peak is significantly greater that for the heavier ions demonstrating that the F+ ions are much more energetic - and therefore more difficult to collect. Bear in mind that the highest peaks have been truncated and that the half-width of the CF3+ peak, for instance, is less than it might appear from the figure. For more information on CF4 see Sieglaff et al. (2001). The collection efficiency problem, and the approach adopted in this laboratory to overcome it, are discussed in Straub et al. (1995) and Straub et al. (1996).