Charge Transfer Data


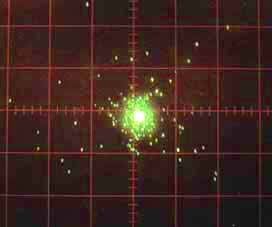
Position-sensitive Detector Display

To the right is a photograph of the screen of the oscilloscope that is used to monitor the position-sensitive detector. Each bright spot shows the position of impact of a single 1.5 keV hydrogen atom on the detector. The active area of the PSD is round and only the central portion of it is shown.

 'scope trace


He+-He Charge Transfer Distribution

The figure to the right shows the result of accumulating 1.5 keV helium counts for a longer period of time. The oscillations are due to interference between different scattering amplitudes and are particularly prominent for this reaction. Note that the vertical axis is logarithmic. For further information see Gao et al. (1988).

He+/He distribution

He+-He Charge Transfer Cross Section

Analysis of the above data yields the differential cross section shown (blue points, 2003). The red curve was obtained by an earlier, higher resolution measurement Gao et al. (1988).

He+/He cross section