IT’S
NOT COOL TO BE HOT IN HOUSTON
Ronald L. Sass
Department of Ecology & Evolutionary
Biology
Rice University
Houston, TX 77005
Janet Taylor moved to Houston from the Midwest as an adult.
Janet lives with her husband in a quiet residential area near the Texas Medical
Center. She is a physically active woman who is trying to adjust her life style
to the city’s hot and humid summer climate. It is mid August and she has
just returned home after an intense game of tennis on an outdoor court near
her residence. In spite of constantly drinking large quantities of water during
her match, she feels overheated and ready for a cold shower. Her skin temperature
is over 105°F and her face is rosy-red with heat. She considers watering
her outdoor plants before showering. They too appear to be drooping with heat
and thirsty for a drink. The temperature in her back yard is already over 95°F
and it is not even noon! Janet rejects the impulse to protect her plants in
favor of her comfortable air-conditioned sunroom, at least until it is more
comfortable outside. As she cools down, she wonders if she should give up tennis
until the weather gets cooler. But that may be two or three months away and
tennis is a social as well as a health imperative with her. "If only the
temperature were 10 degrees cooler," she wishes, "I would be a whole
lot happier living here."
Janet is not alone in trying to stay comfortable in the Houston
summer. All but a very few homes and places of work as well as the great majority
of the cars, trucks and buses of Houston are air-conditioned. People spend as
little time as possible out of doors, moving as quickly as possible from one
air-conditioned oasis to another. Those whose jobs require them to be in the
heat take special precautions not to be adversely affected, staying in the shade
as much as possible and drinking lots of liquids. The intense summer heat also
contributes to increasing the amount of smog pollution in the atmosphere. The
heat is not only uncomfortable, it is unhealthy.
The tragedy of Houston’s urban heat condition is that a significant portion
of it is caused by the very people who live and work in the city and suffer
from it. Cities have been known for some time to be noticeably warmer than the
surrounding countryside, particularly on hot, cloudless, and windless days.
Temperature differences of as much as five or ten degrees Fahrenheit between
a city such as Houston and nearby farmlands and prairies are not uncommon. This
phenomenon is called the urban heat island (UHI) effect. A city like Houston
may develop its own climate, one that is different from that of the surrounding
countryside. But what causes cities to be warmer than near rural areas? What
does the urban microclimate mean for those of us who live in Houston and should
we be concerned about it? Would it improve our quality of life to do something
about it and, indeed, is it possible to make cities cooler? These are questions
that will be considered in this article.
What are the various factors that determine
a particular climate?
Before attacking the subject of heat islands, a quick look
at some general climate concepts will be helpful to our understanding. For example,
the daily temperature in Houston, similar to that of other temperate or sub-tropical
locations, varies from month to month in a significant and fairly predictable
way. Everyone expects an annual cycle of seasons and plans to wear lighter clothes
in the warmer summer time and heavier clothes in the colder wintertime. We are
familiar with the fact that people who live further north can generally expect
to be colder in the winter than those of us who live further south. We in Houston
accept much warmer temperatures in the summer. These everyday experiences are
consistent with the concept that the seasonal position of the sun, relative
to our location is a major factor in determining our local climate. The sun
supplies us with a certain amount of energy and we experience a certain heating
and related temperature. The average monthly energy that we receive from the
sun at a particular location on Earth changes during the year and so does the
average monthly temperature at that location--the two variables are correlated
in time. We can see this for ourselves in the graph in Figure 1 where both the
solar energy received and average daily temperature in Houston are plotted by
month. For a given month the value of the temperature and solar radiation are
both averaged over all the days of the month for the period from 1961 to 1990.
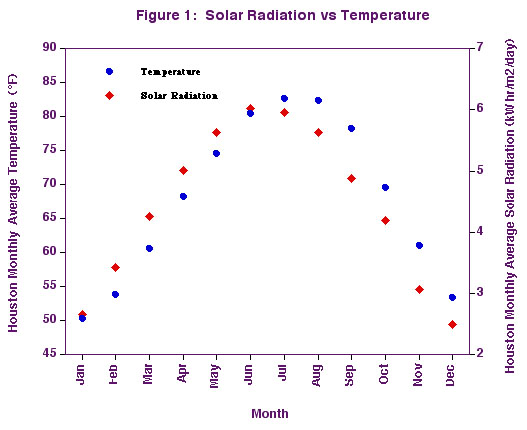 One
notable feature of this graph is that changes in both solar radiation and temperature
are closely coupled throughout the year. Note that he solar radiation peaks
about 1.5 months before the temperature. The reason for this time lag will be
discussed later. Now we will consider only the general change in temperature
with solar radiation. As the solar radiation increases or decreases, the temperature
responds accordingly. In fact, to a very good approximation, the temperature
in Houston changes by 8.6°F whenever the solar energy changes by one kilowatt-hour
per square meter per day. This is true when the temperature decreases as well
as increases. Amazingly, this dependence of temperature on solar input is very
similar for most cities in the United States; even those located much farther
north than Houston. The average monthly temperature in New York City, for example,
is observed to change by a similar 8.4°F when the solar energy changes by
one kilowatt-hour per meter square per day. The monthly average temperatures
of Houston and New York are certainly different. But then, so are the average
monthly solar radiation values.
One
notable feature of this graph is that changes in both solar radiation and temperature
are closely coupled throughout the year. Note that he solar radiation peaks
about 1.5 months before the temperature. The reason for this time lag will be
discussed later. Now we will consider only the general change in temperature
with solar radiation. As the solar radiation increases or decreases, the temperature
responds accordingly. In fact, to a very good approximation, the temperature
in Houston changes by 8.6°F whenever the solar energy changes by one kilowatt-hour
per square meter per day. This is true when the temperature decreases as well
as increases. Amazingly, this dependence of temperature on solar input is very
similar for most cities in the United States; even those located much farther
north than Houston. The average monthly temperature in New York City, for example,
is observed to change by a similar 8.4°F when the solar energy changes by
one kilowatt-hour per meter square per day. The monthly average temperatures
of Houston and New York are certainly different. But then, so are the average
monthly solar radiation values.
Energy from the sun heats the Earth. But the Earth does not
utilize all of the energy coming from the sun. Some energy is reflected back
into space without being absorbed. All of us have experienced differences in
temperature as we move about the city, particularly as we move from sunlight
into cooler shade. This is because clouds are very good reflectors of the sun’s
rays. Under a cloud, the surface temperature may be cooler than expected because
much of the sun’s energy is reflected by the clouds and never has a chance
to warm up the surface of the Earth.
Some places feel hotter in direct sunlight than others do.
This is true because different surfaces interact with the sun’s rays in
different ways. Some surfaces are very good reflectors of the sun’s rays
and therefore do not absorb enough energy to become very hot. Other surfaces
become very hot—even hotter than the ambient air temperature because they
are poor reflectors of the sun’s rays but very efficient absorbers of the
sun’s energy. The total fraction of solar radiation that is reflected by
a particular surface is called the albedo of that surface. The higher the albedo,
the more energy is reflected and the less is absorbed.
I remember a day during a visit to India in 1993. I was visiting
a very famous Hindu temple in New Delhi during a very hot sunny summer day.
It is customary to remove one’s shoes before entering a Hindu temple building.
The open court area leading into the temple was paved with a mosaic of white,
red, and dark brown tiles. Walking barefoot over the tiles was a painful reminder
of scientific observation. The brown tiles were so hot that I could not stand
still on them without blistering my feet. The red tiles also felt hot but not
painfully uncomfortable. And the white tiles felt cool and comfortable. Most
people were crossing this court area by moving from one white tile to the next,
much as a child would walk to school avoiding the cracks in the sidewalk in
order to "not step on a crack and break somebody’s back!" Avoidance
was necessary because of the different albedos of the three colors of tiles.
The white tiles were very reflective, absorbing little of the sun’s energy
and were cool. The red tiles had a lower albedo and were warmer and the brown
tiles were very hot because they reflected very little of the sun’s rays.
The energy transfer from the sun to the Earth is an example
of radiant heat transfer. There is another radiative energy transfer that is
equally important to our understanding of climate but much less intuitive, namely
the transfer of radiant energy from the Earth system back into space. Both transfer
processes are referred to as black body radiation. It is a property of all matter
to emit radiant energy. In general, hotter the bodies emit more radiant energy
at shorter wavelengths.
The concept of radiant energy can be illustrated by an experience common to
all. Imagine turning on a heating coil on an electric stove. If you suspend
your hand a couple of inches above the burner, you soon notice your hand feeling
warmer. As time passes, your hand feels hotter and hotter. At the same time
the burner may begin to show a faint red glow. If you continue this experiment,
the burner will eventually glow white and your hand will become very hot. This
is also an example of radiant energy transfer. The burner coil is emitting radiant
energy just as the sun does, only at a longer wavelength. This energy is mainly
in the infrared portion of the radiation spectrum but becomes partially visible
light as the temperature of the radiating body increases. The amount of energy
emitted by a body also increases as its temperature increases (actually as the
fourth power of its temperature so the rate of increase is quite pronounced).
The sun is very hot, and therefore it not only emits large
amounts of radiant energy, but it also emits much of this energy in the ultra-violet
and the visible part of the energy spectrum. This energy is referred to as short-wave
radiation. We not only get warm from this energy, but it also illuminates the
world for us.
The Earth and everything in it also emits radiant energy. Because the Earth
is cooler than the sun, its characteristic radiation is not visible, but rather
is in the lower energy infrared portion of the spectrum. This energy is referred
to as long-wave radiation. The atmosphere not only receives this energy from
the Earth’s surface, but the atmosphere, because it contains matter, radiates
energy back downward to the Earth and as well as outward into space. Most of
the time the atmosphere is at a cooler temperature than the Earth’s surface.
Thus the amount of downward long-wave radiation to the Earth is less than the
original long-wave radiation from the Earth to the atmosphere. The components
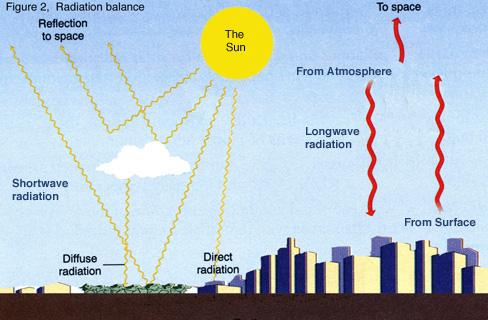
leading to a net radiation balance are illustrated in Figure 2. The global Earth-ocean-atmosphere
system is solely powered by the energy it receives from the sun. All processes
taking place on Earth ultimately depend on this source of energy. After doing
work, this energy stays in the system as heat. This heat could cause the temperature
of the Earth system to continuously increase without limit if it were not removed.
This catastrophe is prevented by the continuous loss of energy back to space
by the long-wave radiation emission characteristic of all matter.
 When
the outgoing heat energy from the Earth exactly balances the incoming sun’s
radiation, the Earth’s average temperature is stable. However since parts
of the Earth system, such as the city of Houston, can exchange energy with other
parts, these energy terms do not necessarily balance locally. Local temperatures
are influenced by a complex array of other effects such as wind, evaporation
and rain, and even heat from our furnaces. Heat energy is gained by some of
these processes and lost by others. And the temperature we experience is the
net result of the balance among them. As with all physical processes, energy
must be conserved. The amount of energy entering a defined system (the city
of Houston for example) during a particular time period such as a day, must
equal the amount of energy leaving plus the amount of energy stored in the system
during that time. This equation will allow us to look in a precise and quantitative
way at the many differences between urban and rural environments. To do this
we need to define several energy terms.
When
the outgoing heat energy from the Earth exactly balances the incoming sun’s
radiation, the Earth’s average temperature is stable. However since parts
of the Earth system, such as the city of Houston, can exchange energy with other
parts, these energy terms do not necessarily balance locally. Local temperatures
are influenced by a complex array of other effects such as wind, evaporation
and rain, and even heat from our furnaces. Heat energy is gained by some of
these processes and lost by others. And the temperature we experience is the
net result of the balance among them. As with all physical processes, energy
must be conserved. The amount of energy entering a defined system (the city
of Houston for example) during a particular time period such as a day, must
equal the amount of energy leaving plus the amount of energy stored in the system
during that time. This equation will allow us to look in a precise and quantitative
way at the many differences between urban and rural environments. To do this
we need to define several energy terms.
We have already become acquainted with the short and long-wave
radiant energy terms as energy is transferred back and forth between the Earth
and space. These we will specify as:
QI = Incident (direct and diffuse) solar radiation,
QR = Reflected solar radiation,
QLu = Upward surface emission of long-wave length radiation,
QLd = Downward atmospheric emission of long-wave length radiation,
Q* = Net solar energy (positive or zero) = QI - QR, and
QL = Net infra-red energy = QLd-QLu (generally negative or zero)
Other energy terms identify energy moving about the Earth and
between the surface and the atmosphere. These types of energy are involved in
modifying the temperature at various locations. They are:
QF = Anthropogenic energy such as from industry, transportation,
heating and AC
QE = Latent heat from evaporation of water from trees, soil, bodies of water,
etc.
QH = Sensible heat carried by vertical and horizontal air motion, including
wind
QS = Storage heat flux within the system (ground, buildings, etc.).
There are many ways of expressing energy—calories, joules,
British thermal units among others. The energy unit most commonly used to express
the consumption of electricity is the kilowatt-hour (kWh). A kilowatt is equal
to 1000 watts. Named in honor of James Watt the developer of the steam engine,
a watt is really a unit of power and measures the rate at which energy is utilized.
A watt is defined as one joule of energy per second. Therefore a kWh is equivalent
to the consumption of 1000 joules every second for one hour. Since there are
3600 seconds in an hour, 1 kWh = 1000 x 3600 joules or 3.6 million joules or
3.6 megajoules (3.6 MJ). Much of our discussion here will be a comparison of
the consumption of various energy forms over a period of one full day. Thus
we may deal in units of kWh/day. And rather than working with total energy values
for a whole ecosystem, we will focus on an individual square meter as a representative
unit of area—thus energy values will be in units of kWh/day/m2 or MJ/day/m2.
All of this nomenclature may seem rather complicated, but it is important to
grasp it firmly before continuing to grapple with the bookkeeping of climate.
Let’s try to think of it spending money rather than using energy. If one
dollar is the monetary equivalent of one joule of energy, then spending one
thousand dollars per second for an hour a day is the equivalent of utilizing
a kilowatt-hour of energy during the day. This intensity of spending is equal
to 3.6 million dollars a day just as the use of one kWh/day is equal to a daily
energy usage of 3.6 million joules of energy or 3.6MJ/day. For the sake of comparison,
1 kWh or 3.6 MJ of energy is enough to vaporize (boil) about 1 2/3 quarts of
water.
All of these energies vary from moment to moment during day
and the year. And they also vary from one place to another. For example, the
daily solar energy values for Houston presented in Figure 1 vary from one month
to the next. For a given month a single value represents an average of all the
instantaneous sunshine intensity values during the whole day for all days of
the month over a 30 year period. Within a 24-hour day the solar energy varies,
peaking sometime around noon and falling to zero between sunset and sunrise.
Our task of understanding the urban heat island effect will be made much simpler
by looking at time averaged energy values rather than constantly varying instantaneous
values. An analogous situation is involved when planning one’s budget needs.
A person need consider only monthly electric bills over the year rather than
worry about minute by minute electric energy production requirements.
How are urban climate factors different from
those of surrounding rural areas?
A diagram of the energy balance for a typical natural landscape
in a rural location near Houston, Texas is shown in Figure 3a. A companion energy
budget for an urban area such as Houston is shown in Figure 3b. The various
energy terms vary from day to day, but those in the figure are characteristic
of those for a typical sunny summer day in Houston and the surrounding rural
environment.
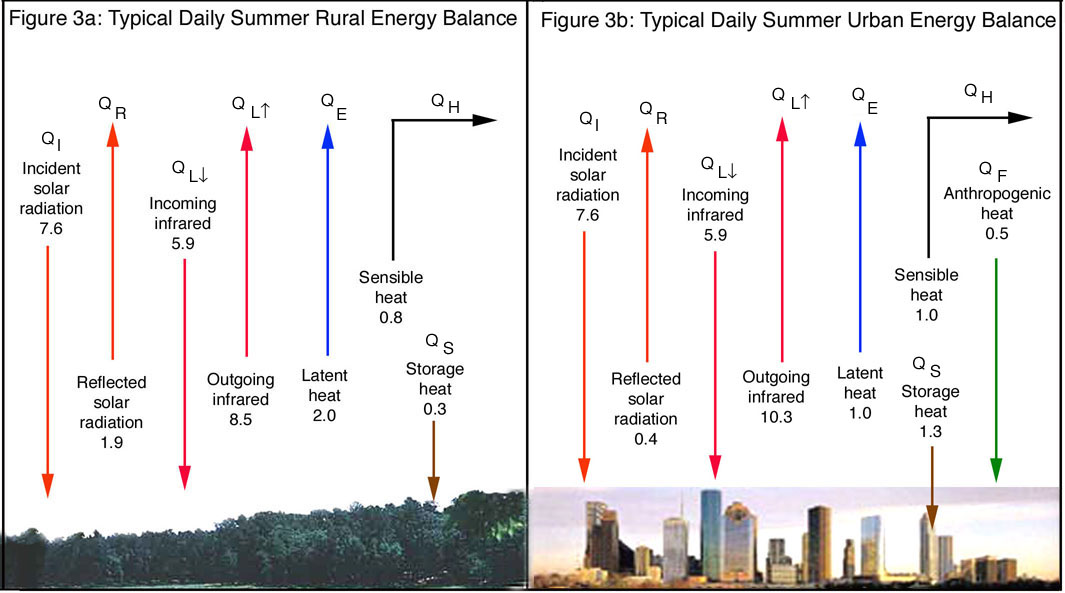
Net energy from the sun and surface reflectance
Both rural and urban systems obtain energy from radiative processes, ultimately
gaining energy from the sun and subsequently losing energy back to the upper
atmosphere and space. Short-wave radiation from the sun is absorbed only during
the daytime, but the long-wave radiation emitted by the earth system is lost
all the time. Consequently, the earth’s surface warms during the day and
cools at night by these radiative processes. The incident solar radiation, QI,
is 7.6 kWh/m2/day for both locations because the same sun shines on both environments
with equal intensity. With an albedo of 0.25 typical of a rural forest ecosystem,
the reflected solar radiation, QR, is 1.9 kWh/m2/day in the country. However,
because of a high density of low reflecting building and roadway surfaces in
most cities, urban ecosystems may have an average albedo as low as 0.05, resulting
in an urban reflected sunlight of only 0.4 kWh/m2/day. Thus the net energy obtained
from the sun in the rural case is 5.7 kWh/m2/day while that in the urban case
is 7.2 kWh/m2/day, or 1.5 kWh/m2/day more. As shown in Figure 1, an increase
of 1.5 kWh/m2/day in solar radiation could result in a temperature increase
of almost 13°F, changing April into June! Surface albedo is indeed a very
important factor in urban heating and one that can be addressed by a change
in the reflectivity of construction materials.
Radiant heat and temperature
Every material substance gives off radiant energy characteristic
of the temperature of that substance. The long-wave upward radiation from both
rural and urban environments will depend on the average effective temperature
of the respective surfaces. Daytime rural summer surface temperatures in East
Texas typically peak in the afternoon at about 30°C (86°F) with the
nighttime minimum temperature a relatively cool temperature of 22°C (72°F).
A realistic value of QLu for such a rural system is 8.5 kWh/m2/day. On the other
hand, daytime urban surface temperatures can reach values well over 50°C
(122°F) with a nighttime cooling of perhaps to 24°C (75°F). The
value for QLd in the urban environment with this temperature range is 10.3 kWh/m2/day.
The long-wavelength downward radiant energy back to the earth surface originates
in the higher atmosphere when upward energy is absorbed, warming the atmosphere
and causing it to reemit this energy. Downward atmospheric emissions of long-wavelength
radiation are somewhat lower in energy than the companion upward radiation because
the higher atmosphere, in general, is cooler than the earth’s surface and
companion atmosphere. Because of close proximity, the effective temperatures
of the higher atmospheres over both the rural and urban environments can be
considered to be equal. High levels of pollutants in the urban atmosphere may
be heat trapping and cause the urban upper atmosphere to be hotter than that
of purer rural air. The presence of pollution would then cause the downward
radiant energy term to be larger thus increasing urban heating. In this example
the downward radiant energy flux is 5.9 kWh/m2/day. It is the same in both rural
and urban environments, indicating that the temperature of the atmosphere is
the same over both. The net loss of long-wave radiant energy from the rural
environment is -2.6 kWh/m2/day and that from the hotter surfaces of the urban
environment is -4.4 kWh/m2/day. The urban environment gains more energy from
the sun than the surrounding rural area does, but, because of its higher temperature,
it also loses more. Adding all four of the radiative energy terms together,
we find that the rural area gains 3.1 kWh/m2/day while the urban area gains
only 2.8 kWh/m2/day. If that were the whole story, the rural area appears to
be gaining more energy per day than the urban area and thus should reach a higher
average temperature. This is not the case because of other processes taking
place and there is more to the story as can be seen by looking at the other
energy terms in Figure 3.
Anthropogenic heat production
Everyone uses energy to make life more pleasurable and productive.
How much residential energy is used depends on individual habits and needs,
but is fairly accurately accounted for by one’s monthly fuel and electric
bills. During the Houston summer, for example, about 75% of the residential
use of electricity is for air conditioning. Likewise different people travel
different distances in their cars with each person’s transportation energy
reflected in what is spent for gasoline. Everyone who uses the products of or
works in commercial businesses and industrial facilities ultimately pays for
the energy used in these establishments.
A convenient way to keep track of all of the different direct
human energy uses is to divide the total for the whole city by the number of
citizens in the city. The result is the average per capita consumption of energy.
This number is also the average per capita amount of energy added to the environment.
For Texas, this number is about 460 kWhr/day/person. For comparison, all energy
terms are given in kWhr/day/m2. To convert to these units, we need to know how
many people occupy a square meter in Houston. According to the US Census Bureau
(1990), Houston proper contains 1,631,000 people and covers an area of 540 square
miles (1,382 square kilometers). A square kilometer contains a million square
meters, so the area of Houston is 1,382,000,000 square meters. This results
in a population density of 3,020 persons per square mile or 0.00116 persons
per square meter. If one person produces 460 kWhr/day of energy, then one meter
square’s worth of persons would produce 0.53 kWhr/day/m2. This figure compares
well with the estimate of 0.5 kWhr/day/m2 depicted in the model shown in Figure
3. Note that no anthropogenic heat production is indicated in the rural energy
balance. That is because the density of people in a rural environment is so
low that the energy production of these people is negligible.
Latent heat and the vaporization of water
An energy term in Figure 3, which is very large in the country
and much smaller in the city, is the latent heat term. This term has to do with
the evapotranspiration of water. The latent heat is heat required in the vaporization
of water. The process is called evapotranspiration because it is the combination
of two processes, direct evaporation of standing and soil water and transpiration,
which is the movement of water from the soil through plants into the atmosphere.
The energy needed for both processes is the same. It is also the same as the
heat energy needed to boil water on a stove. As energy is used to evaporate
water from a surface, heat is withdrawn with the water vapor and the surface
cools. This is true of our bodies as we cool by evaporating perspiration and
it is true of the Earth as water vapor is formed and transported into the atmosphere.
The latent heat of vaporization of water at normal ambient temperatures is approximately
2.46 million Joules per kilogram of water. Remember that one kWhr is 3.6 million
Joules. Therefore a kilowatt-hour of energy will evaporate 3.6 divided by 2.46
or 1.46 kg of water. A kilogram is equivalent to 2.205 pounds.
We have been working with units of kilowatt-hours per meter
square per day. Spread over 1 square meter, 1.46 kg of water would have a depth
of 0.146 centimeters. So, if our rural environment spends 2.0 kWh/m2/day of
energy on evaporating water, it will evaporate the equivalent of 0.292 centimeters
of standing water per day. In one year or 365 days, that would amount to about
107 centimeters or 42 inches of standing water. Forty-two inches of water is
essentially equal to the annual rainfall in the Houston area. Thus in our rural
example, the latent heat loss indicates an assumption that the annual evapotranspiration
is equal to the annual precipitation and that there is no water runoff or change
in soil moisture content from year to year. If these assumptions are appropriate
for the rural ecosystem, why is the urban system so different? The stated urban
latent heat loss is 1.0 kWh/m2/day, 50% of the rural value, indicating that
evapotranspiration in the city accounts for only half of the precipitation.
Other processes must then remove the remaining water. A lack of trees and shrubs
in the city reduces the amount of water that can be evaporated through transpiration,
especially in industrial, commercial, and densely populated high-rise residential
areas. In a rural situation with a healthy ground cover of grasses, shrubs and
trees, perhaps half of the evaporative water loss is through the plants. Also,
in a city, buildings, roads, and parking lots cover large portions of the surface.
Over 50% of the ground area in central business districts is covered over and
therefore sealed to water. This fraction lowers in more residential areas, but
is probably of the order of 25%. These covered over and paved surfaces are impermeable
to water and precipitation runs off into the storm sewer system rather than
being available for evaporation. This impermeability not only affects the energy
and heat balance of the city; it also contributes to other weather problems
such as flooding.
Sensible heat: conduction, convection and
advection
Sensible heat is heat that one can feel or sense. Sensible
heat refers to the back and forth transfer of heat between the atmosphere and
various surfaces. It is heat transferred by conduction within various surface
materials and by convection (vertical) or advection (horizontal) wind as air
moves from one place to another. The arrow denoting sensible heat in Figure
3 is bent to suggest both vertical and horizontal air transfers. It is rather
difficult to specify a characteristic sensible heat value because it depends
on so many variables. Generally, the atmosphere in contact with the surface
of the Earth is warmer than the air above it because it receives heat from the
warm surface. Vertical air motion arises when the warm surface air is lifted
in the atmosphere by heavier colder air sinking. This vertical convection of
air mixes the atmosphere within a certain boundary layer and is most noticeable
in the morning as the sun begins the daily process of heating the Earth from
the surface up.
Sensible heat associated with horizontal wind transfer depends
on the speed, direction, temperature and humidity of the moving air. As an example,
consider a dome of dry air 360 meters or 1000 ft. high extending over the city.
A sensible heat transfer of 1.0 kWh/m2 from building hot surfaces to the air
above them would warm the air dome by almost 14°F (7.7°C) through vertical
mixing. The buildings would cool slightly because of the transfer of heat. This
is how stored heat in structures such as buildings or room radiators heats up
the air. Just as in the case of a room radiator, where the warmed air rises
and mixes, carries off the heat from the source and spreads it throughout the
room, the air over the city moves the heat from the source buildings and pavement.
If the wind is blowing, this heated air then moves on to a new environment,
leaving the city either somewhat cooler or warmer, depending on the temperature
of the air moving in.
The prevailing wind in Houston is generally south to southeasterly
which means that it blows in from the Gulf of Mexico, over the coast and up
from Galveston or east of Galveston. The Gulf waters and associated air are
usually cooler than Houston air. So one might expect that Gulf air blowing into
Houston would replace its hotter air, leading to a negative contribution to
the sensible heat term. That would be desirable, except this air is generally
more humid than Houston air and thus inhibits local water evaporation and reduces
any potential cooling by latent heat transfer.
Storage heat
Storage heat is energy that is absorbed by the various materials
of the surface environment: buildings, pavement, soil, etc. During the day the
energy from the sun heats different areas of the city to different degrees.
For example the daytime summer temperature of an object such as an automobile
sitting under the shade of a tree is noticeably cooler than one sitting in the
full sun. The automobile in the sun has absorbed more storage heat. This storage
heat will in large part be transferred to the atmosphere and the auto will cool
in the evening after the sun sets. Some storage heat will remain in objects
for several days and may not be completely released until a cooler day occurs.
Remember the interesting and related feature observed in the graph in Figure
1. We notice that the solar energy input starts to decrease in its annual cycle
about a month before Houston’s average monthly temperature starts to fall.
This "lag" in the temperature change indicates that heat is stored
up somehow as the city warms up and then is slowly released later, warming the
atmosphere even though the solar energy input is decreasing. The storage of
the sun’s energy in buildings, streets and other surfaces is no different
than the storage of energy from a cooking oven in food which remains hot for
some time after it is removed from the oven and placed on the table. Just as
the food does eventually become cool, so does the city begin to cool after the
energy received from the sun starts its annual decrease, but the city may take
several days or weeks to cool.
How can we vary the various energy factors to
reduce urban heat?
Radiant energy and albedo changes
The main energy-inputs in any microclimate system are short-wave
radiant energy from the sun and long-wave radiant energy exchange between the
surface and the atmosphere. The only really effective way for humans to affect
the radiation energy balance is by changing the albedo of the system so that
more or less of the sun’s energy is reflected back into space. Whenever
possible dark(low albedo) surfaces should be replaced by light(high albedo)
surfaces so that less sunlight is adsorbed.
If there were no variation in these energy inputs, the temperature
of the local environment would remain relatively constant for the whole year.
That situation can be very close to what is observed in a tropical climate where
the heat from the sun and other weather factors are very constant. However,
climate seasons are evident even in the tropics. The sky is cloudier and the
air temperature is cooler during the rainy season than during the dry season.
In Houston, during the month of July, we have grown to expect little change
in the daily temperature and humidity. But is that really what happens? Look
at the data in Figure 4. Figure 4 shows the daily maximum temperature and the
daily rainfall in Houston during August 2001. Although the temperature holds
fairly constant during the first 26 days of the month, there are still some
rather large changes. The 8°F fall in temperature from a high of 101°F
on August 5 to 93°F a short two days later is probably due to the rain and
clouds on August 6-7. Yet precipitation does not appear to be a factor in the
6°F one-day temperature drop and recovery on August 13 or the 8°F drop
on August 19. On the other hand, a significant rain storm on August 26 and lasting
until the end of the month correlates with a major temperature change of up
to 20°F during the last week in August.
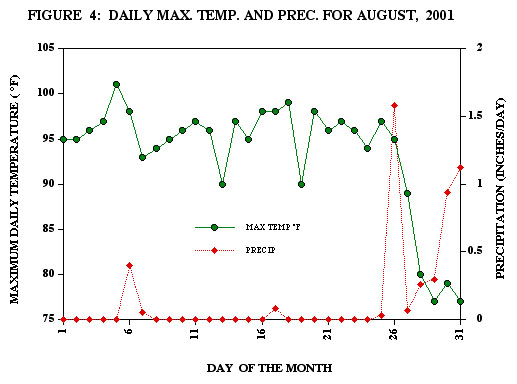 The
point here is to note that all through the month of August, the sun’s energy
at the top of the atmosphere changed very little, yet the day-to-day temperature
changed dramatically. What caused this temperature change was the albedo change
resulting from differences in cloud cover extent and thickness. Increased cloud
cover during rainy days dramatically reduces the net amount of solar energy
that penetrates into the earth-atmosphere system of Houston thereby reducing
the maximum temperature of the city. Since the atmosphere itself does not significantly
alter the short-wave energy from the sun, the albedo change due to clouds could
be replaced by highly reflecting (high albedo) materials near the surface. These
materials would decrease the net energy of the sun by reflecting it just as
the clouds do and thus reduce the temperature of the surface. Such materials
would be new light colored paving and roofing materials. In various parts of
the city, paving and roofing materials cover as much as 50% of the surface and
may have an average albedo as low as 0.10 to 0.15. If the rest of the surface
is grass, trees, sand, and soil having an average albedo of 0.20- 0.25, the
clear sky composite surface albedo would be about 0.15-0.20. If the roofing
and paving material were replaced by highly reflecting materials with an average
albedo of 0.65 to 0.75, then the average albedo of the city could increase as
high as 0.40-0.50. This change would reduce the net solar energy absorbed by
the city surface by almost 40% and result in a temperature change in the city
very similar to that caused by a substantial cloud cover. Such a change could
not only lower the temperature of the city to that of the surrounding rural
temperatures, but could reduce it even further since the city albedo could be
greater than the rural albedo.
The
point here is to note that all through the month of August, the sun’s energy
at the top of the atmosphere changed very little, yet the day-to-day temperature
changed dramatically. What caused this temperature change was the albedo change
resulting from differences in cloud cover extent and thickness. Increased cloud
cover during rainy days dramatically reduces the net amount of solar energy
that penetrates into the earth-atmosphere system of Houston thereby reducing
the maximum temperature of the city. Since the atmosphere itself does not significantly
alter the short-wave energy from the sun, the albedo change due to clouds could
be replaced by highly reflecting (high albedo) materials near the surface. These
materials would decrease the net energy of the sun by reflecting it just as
the clouds do and thus reduce the temperature of the surface. Such materials
would be new light colored paving and roofing materials. In various parts of
the city, paving and roofing materials cover as much as 50% of the surface and
may have an average albedo as low as 0.10 to 0.15. If the rest of the surface
is grass, trees, sand, and soil having an average albedo of 0.20- 0.25, the
clear sky composite surface albedo would be about 0.15-0.20. If the roofing
and paving material were replaced by highly reflecting materials with an average
albedo of 0.65 to 0.75, then the average albedo of the city could increase as
high as 0.40-0.50. This change would reduce the net solar energy absorbed by
the city surface by almost 40% and result in a temperature change in the city
very similar to that caused by a substantial cloud cover. Such a change could
not only lower the temperature of the city to that of the surrounding rural
temperatures, but could reduce it even further since the city albedo could be
greater than the rural albedo.
Anthropogenic heat production change.
In an urban climate system radiant energies are joined by anthropogenic
heat production. Since this energy is completely controlled by human activity,
it is possible for man to heavily affect its influence on the local climate.
The energy balance example presented in Figure 3 shows an anthropogenic
heat production of 0.4 kWhr/m2/day. This value is probably about right or perhaps
a little low for Houston. The actual value is very difficult to estimate and
will of course vary throughout the year as energy requirements change. It will
also vary from one part of the city to another, being highest where there is
a high density of power users, such as in the city center with many office buildings
requiring lighting, heating, or air conditioning. It will also be relatively
high in areas of concentrated heavy industry. Never the less there are certain
general insights that we can obtain. Even though each person has different energy
requirements, an average per capita energy usage is a valid way of assessing
total usage in a city the size of Houston. One would not expect the Houston
average energy usage per person to be the same as that for Chicago or New York
because these places have different climates, energy requirements and infrastructure.
For example, most people in Houston rely on their car a great deal whereas people
living in Manhattan tend to use public transportation and taxis. Heating and
cooling requirements are also different in the two cities.
Population density is another factor to consider in determining the anthropogenic
heat production within a city. In Table 1, the 1990 national census data for
the 20 most populated cities in the United States shows a broad range in population
density.
Table 1: Anthropogenic heat production for the top 20 cities
in the US. Table assumes each city has the national average per capita energy
consumption of 11,230 Watts.
|
Rank
|
Place
|
Population
|
Land area (sq miles)
|
Persons per sq mile
|
Persons per sq meter
|
Anthropogenic heat (kWhr/m2day)
|
|
|
|
1
|
New York city, NY
|
7,322,564
|
308.9
|
23,705
|
0.00853
|
2.3
|
|
2
|
Los Angeles city, CA
|
3,485,398
|
469.3
|
7,427
|
0.00267
|
0.72
|
|
3
|
Chicago city, IL
|
2,783,726
|
227.2
|
12,252
|
0.00441
|
1.19
|
|
4
|
Houston city, TX
|
1,630,553
|
539.9
|
3,020
|
0.00109
|
0.29
|
|
5
|
Philadelphia city, PA
|
1,585,577
|
135.1
|
11,736
|
0.00422
|
1.14
|
|
6
|
San Diego city, CA
|
1,110,549
|
324
|
3,428
|
0.00123
|
0.33
|
|
7
|
Detroit city, MI
|
1,027,974
|
138.7
|
7,411
|
0.00267
|
0.72
|
|
8
|
Dallas city, TX
|
1,006,877
|
342.4
|
2,941
|
0.00106
|
0.29
|
|
9
|
Phoenix city, AZ
|
983,403
|
419.9
|
2,342
|
0.00084
|
0.23
|
|
10
|
San Antonio city, TX
|
935,933
|
333
|
2,811
|
0.00101
|
0.27
|
|
11
|
San Jose city, CA
|
782,248
|
171.3
|
4,567
|
0.00164
|
0.44
|
|
12
|
Baltimore city, MD
|
736,014
|
80.8
|
9,109
|
0.00328
|
0.88
|
|
13
|
Indianapolis city, IN
|
731,327
|
361.7
|
2,022
|
0.00073
|
0.2
|
|
14
|
San Francisco city, CA
|
723,959
|
46.7
|
15,502
|
0.00558
|
1.5
|
|
15
|
Jacksonville city, FL
|
635,230
|
758.7
|
837
|
0.0003
|
0.08
|
|
16
|
Columbus city, OH
|
632,910
|
190.9
|
3,315
|
0.00119
|
0.32
|
|
17
|
Milwaukee city, WI
|
628,088
|
96.1
|
6,536
|
0.00235
|
0.63
|
|
18
|
Memphis city, TN
|
610,337
|
256
|
2,384
|
0.00086
|
0.23
|
|
19
|
Washington city, DC
|
606,900
|
61.4
|
9,884
|
0.00356
|
0.96
|
|
20
|
Boston city, MA
|
574,283
|
48.4
|
11,865
|
0.00427
|
1.15
|
New York City has a density of 23,705 persons per square mile
whereas Jacksonville, Florida has a density of only 837 persons per square mile.
Assuming that everyone living in these cities consumes energy at the national
average rate of 11,230 Watts, the anthropogenic heat production varies from
a high in New York City of 2.30 kWhr/m2day to a low of 0.08 kWhr/m2day in Jacksonville,
Florida. Other cities show energy values that range between these two. On the
high end in such cities as New York where the population density is very high,
this energy input is comparable to that of the sun! On the low end in cities
where the population is really spread out, this energy input is essentially
negligible. Houston falls on the low end of the scale, but not exactly negligible.
It would probably not be productive to attempt to reduce the heat island effect
in Houston by lowering the population density. On the other hand, we need to
be aware that a lower population density may translate into additional heat
generated by a greater use of transportation energy. As Houston grows, the population
density should not be allowed to radically increase if we do not want the temperature
to significantly increase with it.
As consumers, we can do many things to reduce the anthropogenic
heat production in our city. One of the primary ways to do this is to modify
our transportation behavior. We may reduce the amount of driving we do, own
a more energy efficient vehicle, and use public transportation when ever possible.
By making our energy usage more efficient, it is possible to reduce the anthropogenic
heat production by 30-50%. By systematically reducing the population density
of the city, this heat term can be made even smaller as can be determined by
comparing cities of varying population density in Table 1.
Energy outputs as latent heat and sensible
heat
Recall that the energy inputs of radiant energy and anthropogenic
heat are balanced by energy terms such as latent heat, sensible heat and heat
storage in the ground and other materials. Heat energy is generally carried
away from the surface by latent heat.
Heat is also lost to the upper atmosphere by vertical sensible
heat transfer as boundary layer air is vertically mixed. Lateral sensible heat
is normally associated with winds. Winds can either heat or cool a region by
replacing the air in the region with new air from a warmer or colder region
up wind. The greater the sensible heat, the greater the cooling of the surface
as energy is lost.
Latent heat is transferred from the surface to the upper atmosphere
as water is vaporized at the surface either by simple evaporation or by transpiration
through plants. The extent of evapotranspiration is dependent on the moisture
content of the soil and other parts of the system and the ability of water to
transport through the surface. A completely impermeable surface cannot evaporate
water and a ground barren of trees and other plants cannot transpire. Increasing
the number and density of trees and other plants will promote increased evapotranspiration.
This will increase the latent heat energy lost from the surface and the surface
temperature will decrease.
If the area is in the midst of a drought and the ground contains
little or no water, evaporation will decrease. If, on the other hand, the lower
atmosphere is saturated or near saturated with water vapor, evaporation will
decrease. This situation is characteristic of Houston because of the presence
of moisture-laden air from the Gulf of Mexico. In both cases, the latent heat
term will be lowered, the surface system will tend to store energy as heat,
and the temperature will increase.
The presence of a breeze will aid in the evaporation of water
from the surface if the air moving into the region has a lower moisture content
than the air it replaces. Thus, moving air will generally increase the amount
of latent energy production, lowering the storage of heat and lowering the temperature.
Taller buildings in the city center and satellite commercial areas tend to reduce
the wind velocity near ground level unless the canyons between buildings (streets)
are aligned with the wind direction. It is possible to orient and space such
areas to optimize wind flow and thus aid in cooling that area of the city. The
introduction of green spaces in large commercial areas will not only result
in beautiful and functional park space, it can also aid in wind management,
provide cooling shade and increase the amount of permeable soil and plants for
increased cooling through latent heat transfer.
Houston is situated with respect to the Gulf of Mexico such
that during the hottest times of the year the prevailing winds are from the
southeast. As winds sweep in over the Gulf, they traverse an area that is composed
of petrochemical industrial facilities and large areas of fallow fields with
little moisture content. The winds gain a great deal of sensible heat from this
area and its temperature rises. This hot wind then travels across Houston without
bringing any comfort to the already hot city. If this area were to be developed
so that its albedo were raised and planted with trees to increase evapotranspiration,
a "peri-urban cool island" could be developed outside of Houston which
would reduce the sensible heat load of down-wind Houston, thus cooling it. The
peri-urban albedo could be raised in several ways. Trees alone would help a
great deal. Highly reflective structures, commercial or residential could be
put into place. It is even conceivable that the area could be developed into
a large solar-power array that could be used to supply Houston with power that
would replace much of the anthropogenic heat in the city. If the array were
engineered out of a material base with a high albedo, then it would also aid
in the formation of the "cool island." Dagobert Brito of the James
A. Baker Institute for Public Policy at Rice University has estimated that a
one hundred square mile array of solar panels would supply the power needs of
all of Houston as well as form a high albedo area large enough to significantly
cool the winds over Houston! A win-win situation that could eventually pay for
itself. Perhaps other novel ideas could be developed that would be economically
sound and climatically cooling.
How can we affect the quality of life by mitigating
the Houston heat island?
To summarize, the various tools that can be employed to cool
Houston are (1) planting trees in strategic locations; (2) using highly reflecting
urban surfaces such as roofs, streets, and parking lots; (3) developing smart
residential and commercial areas with appropriately placed green spaces; and
(4) influencing the wind field with the development of cool islands upwind from
the city. Together these techniques could reduce the heat load of the city by
several kWhr/m2/day and reduce the temperature by as much as 10 or 15 degrees
Fahrenheit. Cooling the city during the hottest days of the year will certainly
increase our quality of life, simply be making it more comfortable to be outside.
But there are other advantages to cooling the city.
The energy requirement and subsequent cost for air conditioning
our living spaces increase directly proportional to the difference in temperature
between the building or automobile interior and the outside. If the interior
is kept at 75°F and the external temperature is reduced from 105°F to
95°F by heat island mitigation, the air conditioning bill can be reduced
by 33%. This is a substantial economic saving as well as a reduction in the
overall energy requirement of the city.
Houston has a pollution problem. A type of air pollution created
from the combination of nitrogen oxides and volatile organic carbon compounds
has been recognized to be particularly severe in Houston. This mixture in the
presence of sunlight forms "photochemical smog." A major component
of photochemical smog is ozone; other components are various peroxides and organic
nitrogen compounds. Ozone can have adverse effects on humans, animals and plants.
In humans it can cause decreased lung capacity, asthma, inflammation and swelling
of lung tissue and other respiratory problems. Exposure to ozone can also impair
one’s immune system defenses and cause susceptibility to colds, bronchitis
and pneumonia.
Photochemical smog is visible as a haze that also contains
small airborne particles or aerosols. The Houston area and several surrounding
counties fail to meet the standards for ozone concentration set forth under
the federal clean Air Act of 1970 and 1990 and administered by the Environmental
Protection Agency. Ozone is known as the criteria pollutant for these standards.
The Houston area is said to be in "nonattainment" for ozone and is
required to take steps to lower the concentration to attainment levels.
Reactions that form photochemical smog develop when the sun
is most intense, the air temperature is the hottest, the sky is cloudless, the
wind is calm, and the concentrations of precursor pollutants are highest. These
conditions are also those for which the heat island effect is strongest and
mitigation efforts are most able to reduce the ambient temperature. Such reactions
are sensitive to the ambient temperature and will slow down as the temperature
is lowered. A rule of thumb in chemical reactions is that they will slow down
by a factor of two when the temperature is reduced by 18°F. If heat island
mitigation reduces the temperature on the hottest, windless days by as much
as 7 to 8°F, the ozone concentrations may be reduced by as much as 25% and
could be reduced from above to below the EPA mandated attainment level.
Conclusions
The temperature of urban areas can be markedly higher than
that of the surrounding countryside. This fact is known as the "Urban Heat
Island" effect. The interactions that account for this effect are many
and they work together in a complex manner. Yet once we are able to recognize
what these forces are and how they operate, it becomes possible to modify them
in a way that reduces the temperature of the urban environment. These forces
include:
-
albedo—changes the short-wave portion of the radiation
balance by the presence of higher energy absorbing surfaces, structures
with high thermal capacity and buildings of complex three dimensional geometry,
-
anthropogenic heat –production of heat by industry,
transportation and building temperature control,
-
urban surface roughness—reduces sensible heat
loss due to the obstruction of airflow by buildings and other large structures,
-
latent heat reduction—reduces heat loss through
lowered evaporation and evapotranspiration due to water impermeable surfaces,
increased rapid runoff of precipitation, lower urban wind speeds, and loss
of trees and other green areas.
-
atmospheric pollution--changes the long-wave portion
of the radiation balance by trapping heat in the atmosphere,
Ways in which citizens can modify these forces to produce lower
temperatures, obtain better quality of life, and foster enhanced public health
are
-
replacing high radiation absorbing surfaces such as
dark roofs and asphalt streets and parking lots with more highly reflecting
materials,
-
utilizing higher efficiency air conditioning units,
industrial processes, and transportation systems that produce less anthropogenic
heat,
-
designing city areas that include more green space,
better spaced buildings, lower population density and lower transportation
demands by residents,
-
increasing the extent of water evaporation and evapotransporation
by planting more trees and shrubs and reducing the extent of non-permeable
surfaces,
-
acting creatively in designing, planning, and developing
extra-urban areas that directly affect the urban climate and
-
changing your lifestyle in a fundamental way to use
less energy, drive fewer miles, become more supportive of a natural environment
and educate yourself so that you can intelligently promote constructive
environmental change.
The driving factors in the production of the urban heat island
effect are many and are contributed to collectively by all city residents. The
reduction of the urban heat island effect also must be a collective effort.
Everyone in the city is a necessary participant in the process of reducing the
urban heat island in Houston. All of us can help by educating ourselves on the
subject, finding out what steps need to be taken by individuals and by groups,
and convincing the city leaders, both political and economic, that they must
truly be leaders for the creation of a cooler and more healthy Houston.
References for further study
Barry, Roger G. and Richard J. Chorley, Atmosphere, weather
and climate, sixth edition, London and New York, Routledge, 1992.
Landsberg, Helmut E., The Urban Climate, New York, Academic
Press, 1981.
Oke, T. R., Boundary Layer Climates, second edition, London
and New York, Methuen, 1987.
The Heat Island Group, Environmental Energy Technology Division,
Lawrence Berkeley National Laboratory, Berkeley, California, http://EETD.LBL.gov/HeatIsland/
Urban Climate Network, An Internet-based learning and data
resource, http://www.urbanclimate.org/welcome.html
U. S. Environmental Protection Agency Global Warming Site,
Local Actions, http://www.epa.gov/globalwarming/actions/local/heatisland/