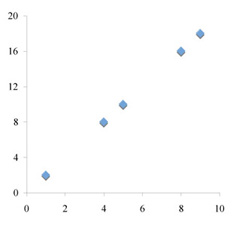
XY plot
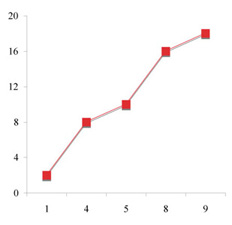
Line graph
The data represent two continuous parametric variables, thus the logical choice is a scatter plot (XY scatter). A line graph, as defined by Excel, would not be appropriate (see below).
A column graph (vertical column graph, sometimes called a bar graph) does not work for these data because time is a continuous parametric variable, not a categorical variable. Horizontal bar, pie, doughnut, line, area, 3D and other "exotic" plot types do not work at all. They are of little use in a scientific context.
A line graph (in Excel) does not work because it treats the independent variable as a discrete, not a continuous, variable. On a line graph the intervals between values for the independent variable are all the same, even if they are unevenly distributed mathematically. For example, consider the data set (1,2), (4,8), (5,10), (8,16), (9, 18). This is obviously a linear relationship in which y = 2x. An XY plot distributes the x values proportionally, along a linear scale. A line graph spaces them equally along the horizontal axis. The intervals from 1 to 4 and 5 to 8 are three times as long as the intervals from 0 to 1, 4 to 5, and 8 to 9.
XY plot
|
Line graph
|
The line graph conveniently includes a trend line (interpolation), but it clearly misrepresents the linear relationship between variables.
To many people the term "line graph" means the same thing as the term "XY plot," and thus they can be misled by graphics software. Read the descriptions of plot types carefully. It is easy to unintentionally misrepresent data by selecting an inappropriate plot type.
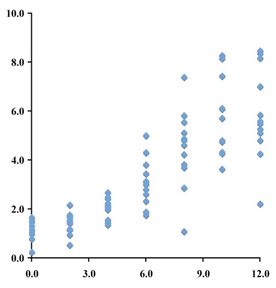
We will use a scatter plot, then. Now, will you plot the raw data or modify them somehow? Raw data from an experiment are sets of individual measurements, just as they are recorded in a notebook. The figure below plots every single individual height measurement versus time.
Are you satisfied with the basic plot design?
YES
NO
Time is the independent variable, to be plotted on the x axis; height (a measured quantity) is a dependent variable, to be plotted on the y axis.
Weekly height measurements for seedlings of Acer palmatum:
| week | 0 | 2 | 4 | 6 | 8 | 10 | 12 |
| measured | 1.2 | 1.4 | 1.4 | 1.9 | 5.8 | 5.7 | 5.3 |
| heights | 0.3 | 0.5 | 2.0 | 3.0 | 2.9 | 4.8 | 5.1 |
| in inches | 1.1 | 1.0 | 2.3 | 3.8 | 4.9 | 4.8 | 8.5 |
| 1.1 | 1.7 | 2.2 | 2.6 | 3.7 | 8.2 | 8.2 | |
| 1.0 | 1.8 | 2.4 | 3.5 | 5.6 | 6.1 | 7.0 | |
| 1.5 | 2.2 | 2.0 | 2.3 | 4.8 | 4.8 | 5.5 | |
| 1.3 | 1.5 | 2.0 | 3.1 | 1.1 | 8.3 | 5.6 | |
| 0.8 | 1.5 | 2.1 | 3.1 | 4.6 | 6.1 | 2.2 | |
| 1.7 | 1.7 | 2.5 | 4.3 | 4.2 | 7.4 | 4.8 | |
| 1.5 | 1.6 | 1.6 | 5.0 | 5.1 | 3.7 | 8.4 | |
| 1.6 | 1.2 | 2.7 | 1.8 | 3.8 | 4.3 | 4.3 | |
| 1.1 | 1.2 | 1.5 | 2.8 | 7.4 | 4.3 | 5.9 |